

Jev cut this AI agent's cost by 61%
In July I wrote that small models should decide what big models see: not routing a task to a cheaper model, but putting small models alongside the big one to choose which tokens it ever reads. I ended that piece by saying the economics were a reason to experiment and not proof, and that someone had to run the test.
Then Jev shipped on 15 September. It is TypeSafe’s first System One model: it writes no text at all, it returns calibrated probabilities over answers your code defines, it costs $0.042 per million input tokens, and it answers in a few hundred milliseconds. That combination makes two very concrete versions of the July idea cheap enough to actually measure.
So I tested those two.
Preloading the skills. An agent given a catalogue of internal documents spends a whole round trip deciding which to read and calling a tool to fetch them. Jev can make that decision before the first turn, for a fraction of a cent, and the documents arrive already in the prompt.
Filtering the tool payload. A real API response is mostly fields no agent will act on, and in an MCP setup all of it lands in the context window and gets re-sent on every following turn. Jev can score every field of a response before the agent sees it.
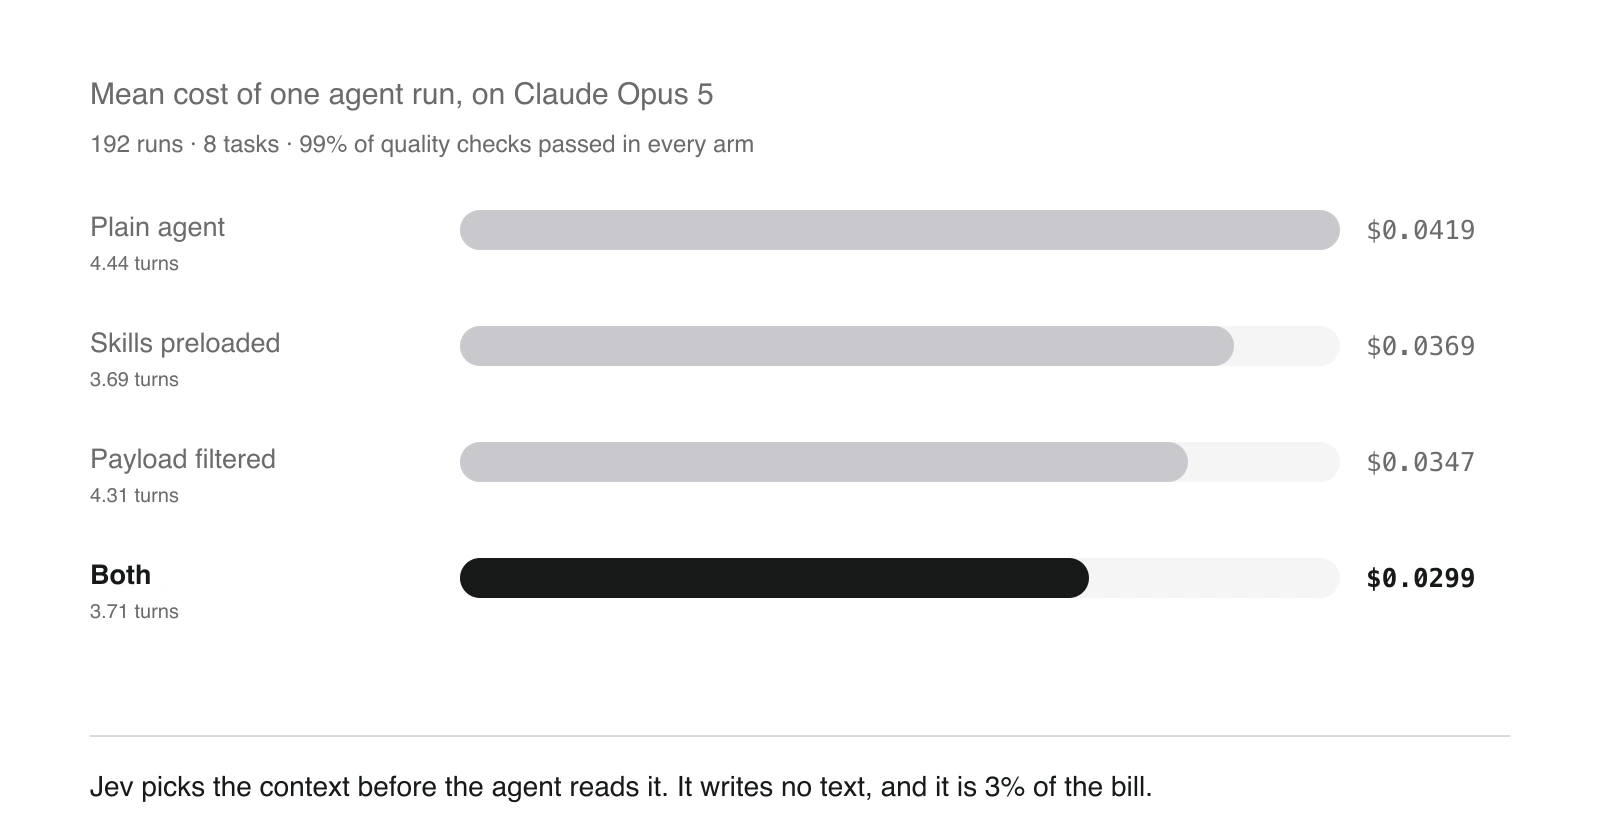
Both are classification problems, not writing problems. Here is what happened across 192 runs on 8 tasks, priced on Claude Opus 5:
Another possible decision for Jev is whether a chat title still fits the conversation. I describe that use case in my article on generating conversation titles. I haven’t measured it with Jev.
Mean cost of one agent run, on Opus 5
The best task came out 61% cheaper. The mean across all eight is 29%, and the worst is 13%. 99% of quality checks passed in every arm, including the plain one, so nothing was traded away to get any of it.
The whole experiment cost $1.17 to run.
What Jev is
It generates no text. You send it a state and a set of typed questions, and it returns a calibrated probability distribution over the answers your code defined. TypeSafe call it a System One model, trained with what they describe as reinforcement learning for calibrated decisions.
| What | Value |
|---|---|
| Price | $0.042 per million input tokens, output free |
| Context | 32,000 tokens |
| Latency, measured here | 300 to 600 ms, p50, regardless of batch size |
| Endpoint | POST /api/alpha/decisions on OpenRouter |
The property that makes this experiment work at all is batching. Every question goes in one HTTP call with the state sent once. Scoring 264 payload fields is one request, not 264.
Mechanism one: preloading the skills
Before the agent’s first turn, Jev reads the request and the one-line description of every skill. It never sees a skill’s body. Anything scoring at or above 0.55 is injected into the system prompt in full.
Step 1 · what the user asks
Step 2 · Jev scores all 11 skills at once, reading only their one-line descriptions
One HTTP call, 11 questions, about 1,500 tokens, $0.00006. Threshold 0.55, so one skill is picked up.
Step 3 · the prompt the agent receives on its very first turn
The read_skill tool stays available, so the agent can still fetch anything the router missed. That matters, because the router does miss things.
Mechanism two: filtering the tool payload
After a tool returns and before its output reaches the agent, every leaf field of the response is scored for relevance to the current request. Anything below 0.35 is stripped.
Step 1 · the agent calls a tool and the API answers in full
Step 2 · what Jev is told about the situation, not just the payload
Step 3 · one call, one score per field. Below 0.35 the field is struck out
Across the six runs of this task, 58 to 62 of the 124 fields survived, and the three the task depends on (status, dunning.days_past_due, account.id) survived in all six.
Step 4 · what reaches the agent’s context window
3,181 characters down to about 1,780, a 44% cut, and none of what went comes back on turns 3, 4 and 5 either.
Worth noticing in those scores: the fields that get cut on this call sit at 0.31 to 0.34 and the ones that stay sit at 0.35 to 0.37. The boundary is genuinely a boundary, and a few fields cross it between runs. trial_end scored 0.34 in one run and 0.37 in another. Nothing the task needed was ever near it.
Where the safety actually comes from
That third step, the state, is where the whole thing is decided. The same threshold with a poorer state is dangerous. With a richer one it is both safer and more aggressive at the same time.
Measured in isolation on the field that decides the dunning task:
| What the state contains | account.id | metadata.account_id | Kept |
|---|---|---|---|
| request + tool + arguments | 0.18 | 0.20 | 51 / 124 |
| + the policies it is following | 0.19 | 0.18 | 50 / 124 |
| + what it has already done | 0.33 | 0.25 | 40 / 124 |
| + the tools it can still call | 0.73 | 0.76 | 27 / 124 |
The two middle columns are the scores given to the field the task actually depends on. The last is how many of the 124 fields survive the 0.35 cut.
Adding the skills changes nothing. History helps a little. The trigger is the list of remaining actions. Until the scorer knows that a billing_set_account_state(account_id, …) call is waiting, an account id is just another string.
The general form of it, which is the part that carries to another setup:
A field is not useful in itself. It is useful for what the agent is about to do with it, and that information is not in the payload. It is in the schema of the tools still available.
Where the gains are, and where they are not
The two mechanisms track completely different things, and knowing which one applies to your workload matters more than the average.
Preloading responds to removable turnsNot to payload size
- Best on a task that needs one policy and would spend a turn fetching it
- Worth nothing on a task that needs no skill
- Can go negative: a wrongly loaded skill is re-sent on every turn
Filtering responds to payload densityNot to task length
- Best where most of the bytes are text nobody reads
- Near zero where every field is load-bearing
- Compounds, because a removed field is not re-sent next turn
The spread is large. On the task where six help-centre articles arrive and only updated_at matters, filtering removes 84% of the payload and 63% of the input tokens. On the incident task, where nearly every field is used, it removes 5%. Same agent, same threshold, a factor of 17 between them.
Cost on Opus 5, per task, plain agent versus both mechanisms:
| Task | Shape | Plain | Both | Gain |
|---|---|---|---|---|
| stale docs | short · very sparse payload | $0.0639 | $0.0252 | −61% |
| refund | medium · mixed | $0.0419 | $0.0249 | −41% |
| incident | short · dense | $0.0340 | $0.0241 | −29% |
| dunning | short · mixed | $0.0187 | $0.0135 | −28% |
| lookup | one call · sparse | $0.0083 | $0.0068 | −17% |
| gdpr | medium · mixed | $0.0336 | $0.0282 | −16% |
| sla | long · mixed | $0.0442 | $0.0378 | −15% |
| postmortem | very long · mixed | $0.0906 | $0.0792 | −13% |
| mean | $0.0419 | $0.0299 | −29% |
An Opus 5 agent handling 10,000 tasks a month goes from $419 to $299, of which $9 goes to Jev.
The price of your main model decides whether filtering is worth it
This is the result that should change what you do.
Filtering costs Jev tokens on every tool call. Those tokens are a fixed price. The tokens it saves are priced at whatever your agent model costs. So the whole thing is a ratio, and it flips.
| Agent model | Input price | Plain agent | Both mechanisms | |
|---|---|---|---|---|
| GPT-5.6 Luna | $0.20/M | $0.00182 | $0.00221 | +21% |
| Claude Sonnet 5 | $2.00/M | $0.01676 | $0.01253 | −25% |
| Claude Opus 5 | $5.00/M | $0.04191 | $0.02995 | −29% |
Same token counts throughout. Only the agent’s rate changes. On the cheap model Jev is 42% of the bill and filtering costs more than it saves. On Opus 5 it is 3% of the bill.
Solving for the crossover, holding the measured token counts and the usual rate structure, puts it at $0.55 per million input tokens with prompt caching on, and $0.37 without. Below that, do not filter. Above it, filter.
Preloading skills is profitable everywhere, including on the cheapest model, because it costs almost nothing: about 1,500 Jev tokens per run, $0.00006, against a saved turn.
There is a second-order effect worth knowing. Caching roughly halves the bill and reduces the relative value of filtering, because most of what filtering removes would have been cheap cache reads. Filtering is worth more to a deployment without caching than to one with it.
The failure mode
The 0.35 threshold is only safe because of the rich state. An earlier version without it produced the worst kind of failure.
The filter dropped account.id from a Stripe subscription, scoring it 0.18, and also dropped metadata.account_id, the second copy. The agent took the only identifier left and did this:
call:   billing_set_account_state(account_id="cus_PmT4k9WqLr2XbN", state="read_only")
                                              ↑ the Stripe customer id, not the account

report: "I set the associated account to read-only, in accordance with the day-10 policy."
The correct identifier was acct_borealis_4c77. The agent acted on the wrong object and filed a confident report about it.
Anything you deploy needs declared critical paths and a threshold calibrated against them. Two hundredths of a threshold separated “saves a turn” from “saves nothing” on the routing side, and a much bigger gap than that on the filtering side.
What I take from this
Working on AI efficiency is worth the time, and combining models of different sizes and different kinds is where a lot of it lives. What makes this interesting is that a model which cannot write text at all turns out to be a good judge of what a model that writes text should be allowed to see.
Two starting points were tested here. There are many more places the same pattern could apply: choosing which files an agent opens, deciding when a conversation should be compacted, scoring whether a retrieved document is worth its tokens, gating a write before it happens. None of that was measured, and I would not assume any of it works until it is.
The full record is below: the harness, every task, every threshold, all the tables, and the things this does not show.
The full details
Everything from here down is the complete experiment. It is long on purpose. If you only wanted the result, you already have it.
The setup
The agent
About 80 lines. No framework, no agent SDK, no orchestration library. A while loop around fetch:
- POST to OpenRouter’s chat completions endpoint with the message list and the tool schemas in OpenAI function-calling format.
- If the reply has
tool_calls, execute each one locally, push the result as arole: "tool"message, and loop. - If the reply has no
tool_calls, that text is the final answer and the loop ends.
| Parameter | Value | Note |
|---|---|---|
model | openai/gpt-5.6-luna | $0.20/M in, $1.20/M out, 1,050,000-token context |
tools | 17 function schemas | |
tool_choice | auto | the agent decides whether and what to call |
seed | 1000 + repetition index | the only thing varied across repetitions |
max_tokens | 2000 | a ceiling, not a target |
reasoning / reasoning_effort | not set | left at the provider default |
temperature, top_p | not set | left at the provider default |
On reasoning specifically: no reasoning parameter was ever passed, so the model ran at the provider default. A control call made afterwards returns reasoning_tokens: 0, so no separate reasoning budget was being spent and none of the token counts include hidden reasoning tokens. Re-running this at a higher reasoning effort would produce different absolute numbers.
Two safety rails, because a runaway agent loop burns money: 8 turns maximum per run, and 6 tool calls maximum per turn. Neither was hit in the 192 runs. A third rail sums every call and throws once the total crosses a cap, which was set at $2.60 for the campaign.
The world
A fictional B2B SaaS called Northwind Analytics, with the agent as its operations assistant.
17 tools whose payloads imitate the real shape of Stripe, Zendesk, HubSpot, Statuspage, PagerDuty, Slack, Linear and a help-centre CMS: same key names, same nesting, same noise. They are local functions returning fixtures, so nothing leaves the machine. Writes are recorded for grading and return a plausible acknowledgement.
| Tool | Modelled on | Payload |
|---|---|---|
kb_list_articles | a help-centre CMS list endpoint | 28,128 chars |
stripe_list_charges | Stripe GET /v1/charges | 6,993 chars |
kb_get_article | a help-centre CMS read endpoint | 4,966 chars |
stripe_get_subscription | Stripe GET /v1/subscriptions/:id | 3,181 chars |
zendesk_get_ticket | Zendesk GET /api/v2/tickets/:id with side-loads | 2,402 chars |
pagerduty_get_incident | PagerDuty GET /incidents/:id | 1,821 chars |
statuspage_get_incident | Statuspage incident + uptime | 1,711 chars |
crm_get_account | HubSpot company object | 1,117 chars |
read_skill | internal | 988 chars |
stripe_create_refund | Stripe POST /v1/refunds | 479 chars |
linear_create_issue | Linear issueCreate | 202 chars |
billing_apply_credit | internal billing API | 147 chars |
zendesk_reply | Zendesk PUT /api/v2/tickets/:id | 144 chars |
billing_set_account_state | internal billing API | 134 chars |
slack_post_message | Slack chat.postMessage | 124 chars |
billing_apply_discount | internal billing API | 98 chars |
pagerduty_escalate | PagerDuty escalation | 92 chars |
11 skills, Markdown files with a one-line description in front matter and a body carrying the actual thresholds, numbers and formats: churn-save-offers, docs-review-cadence, dunning-playbook, enterprise-contract-terms, escalation-matrix, gdpr-data-requests, incident-comms, oncall-handover, refund-policy, release-notes-format, slack-style-guide. Several bear on no task at all. They are distractors for the router.
8 tasks, chosen to span two independent axes: length, from a single tool call to seven turns, and payload density, from “every field matters” to “76% of the bytes are text to throw away”.
The tasks, verbatim
| Task | Prompt sent as the user message |
|---|---|
T1-refund | ACME Analytics (account acct_acme_9f21) emailed: they say they were charged twice for their November invoice. Check it and sort it out completely, including telling the team. |
T2-sla | Zendesk ticket 48213 is an SLA credit claim from an enterprise customer about October. Work out what they are owed, apply it, and answer them. |
T3-dunning | Subscription sub_1QdRvT2eZvKYlo2CkW8pQm4L is past due. Apply whatever our process says the next step is. |
T4-gdpr | Ticket 48377 just came in on the privacy inbox. Take it from here and do everything the process requires. |
T5-incident | Incident PD-99213 just fired. Handle the escalation and the communications. |
T6-stale-docs | Which of our published help-centre articles are overdue for a review? Track the work that needs doing. |
T7-postmortem | Incident INC-4471 is resolved. Do the follow-up: who was affected, what they are owed, and tell the company where it stands. |
T8-lookup | What plan is acct_borealis_4c77 on and who is their CSM? |
Grading
Deterministic. 59 checks across the eight tasks, each one either a tool call with exact arguments, such as stripe_create_refund(charge="ch_3QRk9X…", amount=14900, reason="duplicate"), or a fact that appears only inside a skill document: the 25% SLA tier, the day-10 rule, the PRIV team, the 30-day deadline.
No LLM judge is involved anywhere. A run that never opens the skills fails the second kind of check mechanically, which is the point: it makes “did the agent actually have the policy” measurable rather than a matter of opinion.
Each task also declares its critical payload paths, the fields its answer depends on. These are never used to steer the filter. They exist so an over-eager filter is visible in the record even on runs that pass anyway.
The arms
| Arm | Skills preloaded | Payload filtered |
|---|---|---|
0 | no | no |
A | yes, threshold 0.55 | no |
B | no | yes, threshold 0.35, rich state |
D | yes, threshold 0.55 | yes, threshold 0.35, rich state |
8 tasks × 4 arms × 6 repetitions = 192 runs, repetitions differing only by seed.
Calibration
Both thresholds were swept offline before any agent tokens were spent.
0.55 for routing is the highest value that keeps full recall on the tasks it was calibrated against. At 0.60, slack-style-guide scores 0.58 on the refund task and the saved turn evaporates. Two hundredths separate a 15% turn reduction from nothing.
0.35 for filtering is only tenable because of the rich state described above. The calibration pass costs about $0.004 because it runs the router and scorer without running the agent at all.
One lesson that generalises: every framing of a question has its own calibration. A threshold does not transfer between two wordings of the same question. Distributions on completely different supports were measured for a task-specific framing and a task-independent one. Recalibrate whenever you reword.
Campaign totals
| Measure | Total |
|---|---|
| Runs | 192 |
| Agent turns | 775 |
| Agent input tokens | 2,118,338, of which 1,685,860 (80%) served from cache |
| Agent output tokens | 130,003 |
| Jev input tokens | 2,065,975 |
| Jev calls | 96 routing + 252 filtering |
| Actual spend | agent $0.2977 · Jev $0.0868 |
| Total, including calibration and discarded variants | $1.17 |
Overall, by arm
| Arm | Perfect runs | Checks passed | Turns | Input tokens | Critical paths dropped |
|---|---|---|---|---|---|
0 | 92% | 99% | 4.44 | 12,960 | n/a |
A | 96% | 99% | 3.69 | 11,809 | n/a |
B | 94% | 99% | 4.31 | 9,967 | 0 |
D | 94% | 99% | 3.71 | 9,396 | 1 |
No technique degraded quality. 99% of checks pass in all four arms. Across 96 filtered calls in arm D, exactly one declared-critical path was dropped and that run still passed. The per-run “perfect” differences between 92% and 96% are within noise at n = 48. The robust effects are turns and tokens.
Mean tokens per run, split the way they are actually billed:
| Arm | Fresh input | Cached input | Output | Jev input |
|---|---|---|---|---|
0 | 2,941 | 10,020 | 741 | 0 |
A | 2,700 | 9,109 | 615 | 1,517 |
B | 1,873 | 8,093 | 723 | 19,457 |
D | 1,496 | 7,900 | 629 | 22,067 |
Arm D cuts fresh input tokens, the expensive kind, by 49%.
Input-token saving per technique, worst to best
| Technique | Minimum | Maximum | Median |
|---|---|---|---|
A skill preloading | −3% on the SLA task | +23% on the GDPR task | 10% |
B payload filtering | +2% on the GDPR task | +51% on stale docs | 17% |
D both | +9% on the postmortem | +63% on stale docs | 26% |
The one negative cell in the whole matrix is A on the SLA task, where the router loads one skill too many without removing a turn. The extra skill goes into the system prompt and is then re-sent on every turn. The two techniques also do not always add up: on the SLA and postmortem tasks, D saves fewer tokens than B alone, for exactly that reason.
How the router actually scored
Mean probability per skill, per task. Loaded means at or above 0.55.
| Task | Skills loaded | Top scores |
|---|---|---|
T1-refund | 2.0 | refund-policy 0.82 · slack-style-guide 0.60 · incident-comms 0.32 |
T2-sla | 2.0 | enterprise-contract-terms 0.95 · refund-policy 0.84 · churn-save-offers 0.13 |
T3-dunning | 1.0 | dunning-playbook 0.95 · churn-save-offers 0.32 · oncall-handover 0.13 |
T4-gdpr | 1.0 | gdpr-data-requests 0.87 · refund-policy 0.27 · escalation-matrix 0.22 |
T5-incident | 3.0 | escalation-matrix 0.93 · incident-comms 0.85 · slack-style-guide 0.69 |
T6-stale-docs | 1.0 | docs-review-cadence 0.93 · slack-style-guide 0.15 · oncall-handover 0.05 |
T7-postmortem | 3.0 | enterprise-contract-terms 0.92 · refund-policy 0.89 · incident-comms 0.58 · slack-style-guide 0.47 |
T8-lookup | 0.0 | slack-style-guide 0.07 · enterprise-contract-terms 0.06 · dunning-playbook 0.04 |
Recall: 132 of 144 needed skills loaded, 92%. One systematic miss and one systematic false positive, both worth stating plainly.
The miss is slack-style-guide on the postmortem task, scoring 0.47, below threshold, in 12 runs out of 12. The task says “tell the company where it stands” and the router does not read that as a formatting question. The agent fetched it itself when it needed it.
The false positive is refund-policy on the SLA task at 0.84 and the postmortem at 0.89. An SLA credit looks like a refund. It is exactly the confusion refund-policy exists to forbid, since the document says service unavailability is not a refund. The router is wrong about form and right about substance, and the agent was not harmed.
The lookup task loads nothing, correctly. No skill bears on it and the highest score is 0.07.
How the filter actually behaved
Arm D, by tool, across 96 filtered calls:
| Tool | Calls | Chars before → after | Change | Keys kept |
|---|---|---|---|---|
kb_list_articles | 8 | 225,024 → 24,834 | −89% | 605 / 1,808 |
stripe_list_charges | 6 | 41,958 → 12,819 | −69% | 405 / 1,584 |
stripe_get_subscription | 6 | 19,086 → 10,637 | −44% | 359 / 744 |
crm_get_account | 30 | 29,400 → 16,723 | −43% | 384 / 1,002 |
zendesk_get_ticket | 12 | 25,620 → 15,787 | −38% | 328 / 822 |
statuspage_get_incident | 9 | 15,399 → 10,734 | −30% | 311 / 540 |
pagerduty_get_incident | 12 | 21,852 → 16,497 | −25% | 428 / 684 |
stripe_create_refund | 6 | 3,012 → 2,610 | −13% | 60 / 108 |
zendesk_reply | 12 | 8,685 → 9,489 | +9% | 24 / 84 |
linear_create_issue | 18 | 5,287 → 6,734 | +27% | 83 / 138 |
billing_apply_credit | 8 | 1,343 → 2,406 | +79% | 42 / 56 |
The read tools are where the money is, and the spread among them is enormous: from −89% on a document list to −25% on an incident where nearly everything is load-bearing.
The write acknowledgements go the wrong way. billing_apply_credit returns 147 characters, and the _trimmed marker appended to it costs more than the fields removed. Filtering a small payload is a net loss, and any production implementation should skip anything under a few hundred characters outright. It was left in so the effect is visible in the record.
Every task, every arm
Prices are the complete cost of one run, agent plus Jev, using the measured fresh and cached split. The Sonnet 5 and Opus 5 columns replay the measured traffic at those models’ prices. Jev’s cost is identical in all three columns.
T1-refund, medium · mixed payload
| Arm | Perfect | Checks | Turns | Tokens in | Payload cut | $ Luna | $ Sonnet 5 | $ Opus 5 | vs 0 |
|---|---|---|---|---|---|---|---|---|---|
0 | 100% | 100% | 4.5 | 15,369 | n/a | 0.00180 | 0.0167 | 0.0419 | n/a |
A | 100% | 100% | 4.0 | 14,247 (−7%) | n/a | 0.00165 | 0.0150 | 0.0373 | −11% |
B | 100% | 100% | 4.3 | 10,719 (−30%) | 65% | 0.00285 | 0.0141 | 0.0331 | −21% |
D | 100% | 100% | 4.0 | 9,899 (−36%) | 66% | 0.00252 | 0.0108 | 0.0249 | −41% |
T2-sla, long · mixed payload
| Arm | Perfect | Checks | Turns | Tokens in | Payload cut | $ Luna | $ Sonnet 5 | $ Opus 5 | vs 0 |
|---|---|---|---|---|---|---|---|---|---|
0 | 83% | 96% | 6.8 | 18,811 | n/a | 0.00192 | 0.0177 | 0.0442 | n/a |
A | 100% | 100% | 6.2 | 19,359 (+3%) | n/a | 0.00193 | 0.0174 | 0.0433 | −2% |
B | 83% | 96% | 6.5 | 15,528 (−17%) | 30% | 0.00286 | 0.0173 | 0.0417 | −6% |
D | 83% | 96% | 6.0 | 16,533 (−12%) | 72% | 0.00312 | 0.0160 | 0.0378 | −15% |
T3-dunning, short · mixed payload
| Arm | Perfect | Checks | Turns | Tokens in | Payload cut | $ Luna | $ Sonnet 5 | $ Opus 5 | vs 0 |
|---|---|---|---|---|---|---|---|---|---|
0 | 100% | 100% | 4.0 | 8,084 | n/a | 0.00080 | 0.0075 | 0.0187 | n/a |
A | 100% | 100% | 3.0 | 6,704 (−17%) | n/a | 0.00079 | 0.0069 | 0.0171 | −9% |
B | 100% | 100% | 4.0 | 7,384 (−9%) | 44% | 0.00129 | 0.0069 | 0.0163 | −13% |
D | 100% | 100% | 3.0 | 6,002 (−26%) | 44% | 0.00123 | 0.0058 | 0.0135 | −28% |
T4-gdpr, medium · mixed payload
| Arm | Perfect | Checks | Turns | Tokens in | Payload cut | $ Luna | $ Sonnet 5 | $ Opus 5 | vs 0 |
|---|---|---|---|---|---|---|---|---|---|
0 | 50% | 94% | 4.2 | 8,344 | n/a | 0.00150 | 0.0134 | 0.0336 | n/a |
A | 100% | 100% | 3.0 | 6,467 (−23%) | n/a | 0.00132 | 0.0114 | 0.0285 | −15% |
B | 83% | 98% | 4.2 | 8,167 (−2%) | 14% | 0.00186 | 0.0129 | 0.0315 | −6% |
D | 83% | 98% | 3.0 | 6,159 (−26%) | 16% | 0.00178 | 0.0116 | 0.0282 | −16% |
T5-incident, short · dense payload
| Arm | Perfect | Checks | Turns | Tokens in | Payload cut | $ Luna | $ Sonnet 5 | $ Opus 5 | vs 0 |
|---|---|---|---|---|---|---|---|---|---|
0 | 100% | 100% | 3.8 | 8,647 | n/a | 0.00151 | 0.0136 | 0.0340 | n/a |
A | 67% | 96% | 3.0 | 7,004 (−19%) | n/a | 0.00121 | 0.0104 | 0.0259 | −24% |
B | 83% | 98% | 3.7 | 8,153 (−6%) | 6% | 0.00168 | 0.0127 | 0.0313 | −8% |
D | 83% | 98% | 3.0 | 6,935 (−20%) | 5% | 0.00143 | 0.0099 | 0.0241 | −29% |
T6-stale-docs, short · very sparse payload
| Arm | Perfect | Checks | Turns | Tokens in | Payload cut | $ Luna | $ Sonnet 5 | $ Opus 5 | vs 0 |
|---|---|---|---|---|---|---|---|---|---|
0 | 100% | 100% | 4.0 | 19,821 | n/a | 0.00265 | 0.0256 | 0.0639 | n/a |
A | 100% | 100% | 3.0 | 18,468 (−7%) | n/a | 0.00260 | 0.0246 | 0.0614 | −4% |
B | 100% | 100% | 4.0 | 9,639 (−51%) | 78% | 0.00262 | 0.0139 | 0.0329 | −49% |
D | 100% | 100% | 3.0 | 7,387 (−63%) | 84% | 0.00235 | 0.0109 | 0.0252 | −61% |
T7-postmortem, very long · mixed payload
| Arm | Perfect | Checks | Turns | Tokens in | Payload cut | $ Luna | $ Sonnet 5 | $ Opus 5 | vs 0 |
|---|---|---|---|---|---|---|---|---|---|
0 | 100% | 100% | 6.0 | 21,294 | n/a | 0.00406 | 0.0363 | 0.0906 | n/a |
A | 100% | 100% | 5.3 | 19,224 (−10%) | n/a | 0.00339 | 0.0297 | 0.0743 | −18% |
B | 100% | 100% | 5.7 | 17,064 (−20%) | 34% | 0.00488 | 0.0343 | 0.0841 | −7% |
D | 100% | 100% | 5.7 | 19,430 (−9%) | 33% | 0.00472 | 0.0324 | 0.0792 | −13% |
T8-lookup, one call · sparse payload
| Arm | Perfect | Checks | Turns | Tokens in | Payload cut | $ Luna | $ Sonnet 5 | $ Opus 5 | vs 0 |
|---|---|---|---|---|---|---|---|---|---|
0 | 100% | 100% | 2.2 | 3,314 | n/a | 0.00036 | 0.0033 | 0.0083 | n/a |
A | 100% | 100% | 2.0 | 3,004 (−9%) | n/a | 0.00038 | 0.0030 | 0.0073 | −12% |
B | 100% | 100% | 2.2 | 3,080 (−7%) | 62% | 0.00047 | 0.0026 | 0.0062 | −24% |
D | 100% | 100% | 2.0 | 2,819 (−15%) | 62% | 0.00056 | 0.0029 | 0.0068 | −17% |
How the prices were computed
Measure once, then reprice. The token counts are the baseline, and every model’s bill is those same counts at that model’s rates.
The billing formula was reverse-engineered from the data rather than assumed. Across all 192 runs, the observed agent cost matches
fresh_input × $0.25/M + cached_input × $0.02/M + output × $1.20/Mto a median relative error of 0.04%. Two consequences. Prompt caching was on the whole time, automatically, with no cache_control markers, and 80% of input tokens were cache reads. And every fresh input token is billed at the cache write rate, which is 1.25× the nominal input price, so the nominal $0.20/M rate is essentially never what you pay in a multi-turn loop.
An earlier theoretical model of caching, where reads at turn t equal the prefix at turn t−1, under-estimated real cache reads by 19%. It was discarded in favour of the measured per-turn split.
| Model | Input | Output | Cache read | Cache write |
|---|---|---|---|---|
openai/gpt-5.6-luna | $0.20/M | $1.20/M | $0.02/M | $0.25/M |
anthropic/claude-sonnet-5 | $2.00/M | $10.00/M | $0.20/M | $2.50/M |
anthropic/claude-opus-5 | $5.00/M | $25.00/M | $0.50/M | $6.25/M |
typesafe/jev-1.13 | $0.042/M | free | n/a | n/a |
| Arm | Luna | Sonnet 5 | Opus 5 | Jev’s share, Opus 5 |
|---|---|---|---|---|
0 | $0.00182 | $0.01676 | $0.04191 | n/a |
A | $0.00166 (−9%) | $0.01479 (−12%) | $0.03688 (−12%) | 0% |
B | $0.00232 (+27%) | $0.01435 (−14%) | $0.03466 (−17%) | 2% |
D | $0.00221 (+21%) | $0.01253 (−25%) | $0.02995 (−29%) | 3% |
The same runs with no caching at all, for reference:
| Arm | Luna | Sonnet 5 | Opus 5 |
|---|---|---|---|
0 | $0.00348 | $0.03333 | $0.08332 |
A | $0.00316 | $0.02984 | $0.07450 |
B | $0.00368 | $0.02798 | $0.06874 |
D | $0.00356 | $0.02601 | $0.06362 |
One assumption is conservative rather than neutral. OpenAI caches automatically and bills every fresh input token at the write rate, which is what was measured. Anthropic caching is opt-in: only content inside a cache_control breakpoint is billed at the write rate and the rest at the plain input rate. Charging all fresh tokens at the write rate therefore over-states the Anthropic columns slightly. Recomputing with fresh tokens at the plain input rate moves the Opus 5 mean from $0.04191 → $0.02995 (−29%) to $0.03823 → $0.02808 (−27%), and no per-task figure moves by more than 3 points.
What this does not show
- One agent model. Everything is measured on
openai/gpt-5.6-lunaat default reasoning. The token counts are the deliverable and the price columns are arithmetic on top of them. A different model would produce different token counts, not just different prices. - n = 6 per cell. Enough for turn counts and token counts, which are near-deterministic. Not enough to separate 92% from 96% quality.
- Fixtures, not live APIs. The payload shapes are faithful. Real endpoints have pagination, partial failures and rate limits that this harness does not exercise.
- The tasks were written by the same person who wrote the skills. The grading is deterministic, but the world is not adversarial.
- Jev’s own calibration was not audited. What was measured is what its scores do to an agent, not whether they are well calibrated in the statistical sense.
- One agent shape. A
whileloop with function calling. Sub-agents, parallel tool calls and long-lived sessions all change the arithmetic.